Battery Costs and EV Manufacturing Economics: What Business Evaluators Should Know
Batteries can represent roughly 20%–40% of electric vehicle production cost in illustrative manufacturing scenarios, but no single percentage reliably describes every manufacturer or model.
The actual share depends on battery capacity, pack pricing, vehicle complexity, sourcing contracts, and factory utilization. Comparing percentages without these details can distort commercial assessments.
For business evaluators, the useful question is whether a manufacturer delivers the required range and performance at a competitive, sustainable cost per vehicle.
This article explains how to calculate battery cost share, interpret industry benchmarks, and assess whether apparent battery savings translate into stronger margins or supplier competitiveness.
How much of an EV’s manufacturing cost comes from its battery?
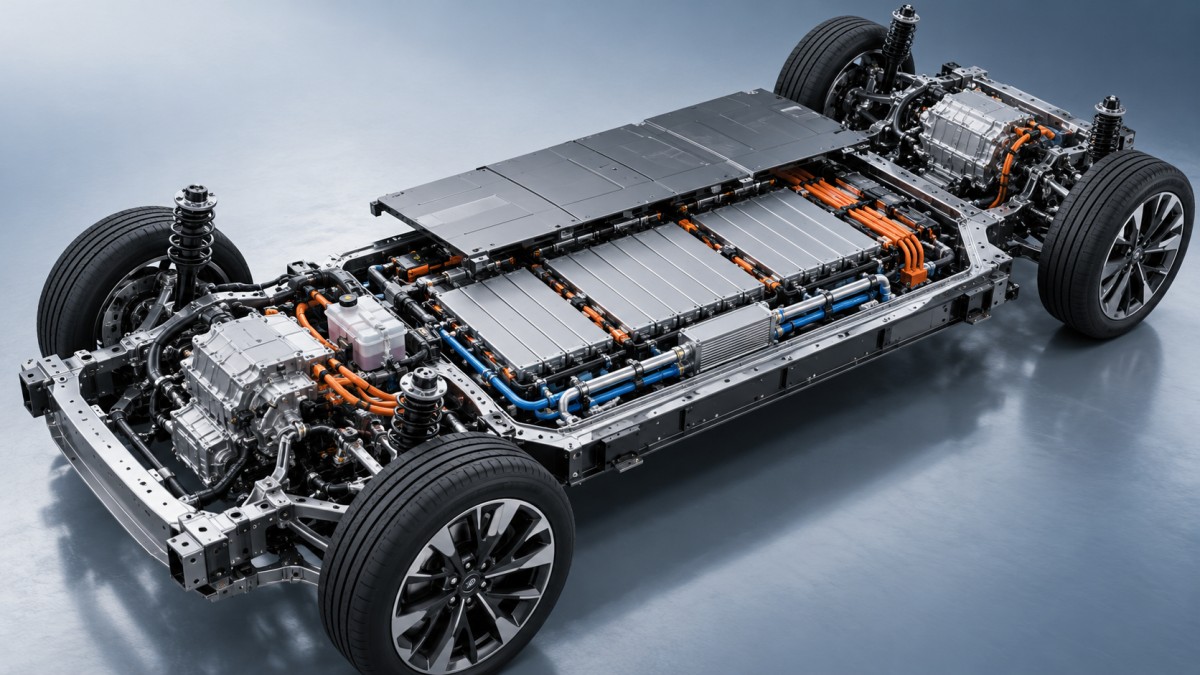
A practical starting point is to model the battery as approximately one-quarter to one-third of manufacturing cost, then test assumptions specific to the vehicle.
This is an evaluation assumption, not a universal industry average. Smaller packs, expensive vehicle equipment, or unusually high assembly costs can reduce the battery’s percentage.
Conversely, a large battery installed in a relatively simple vehicle can account for a substantially higher share, even when procurement pricing is competitive.
Calculate battery cost share by dividing the installed battery pack cost by total vehicle manufacturing cost, using consistent accounting boundaries for both figures throughout.
For example, a 60 kWh pack costing $100 per kWh produces a $6,000 pack estimate. Against $24,000 in manufacturing cost, its share is 25%.
These scenarios demonstrate sensitivity rather than actual model economics. Real comparisons require matched specifications, production periods, delivery locations, and definitions of what the pack includes.
Which cost figures should evaluators compare?
Battery cells, complete battery packs, vehicle manufacturing costs, and retail prices describe different financial measures. Mixing them can produce an impressive but commercially misleading percentage.
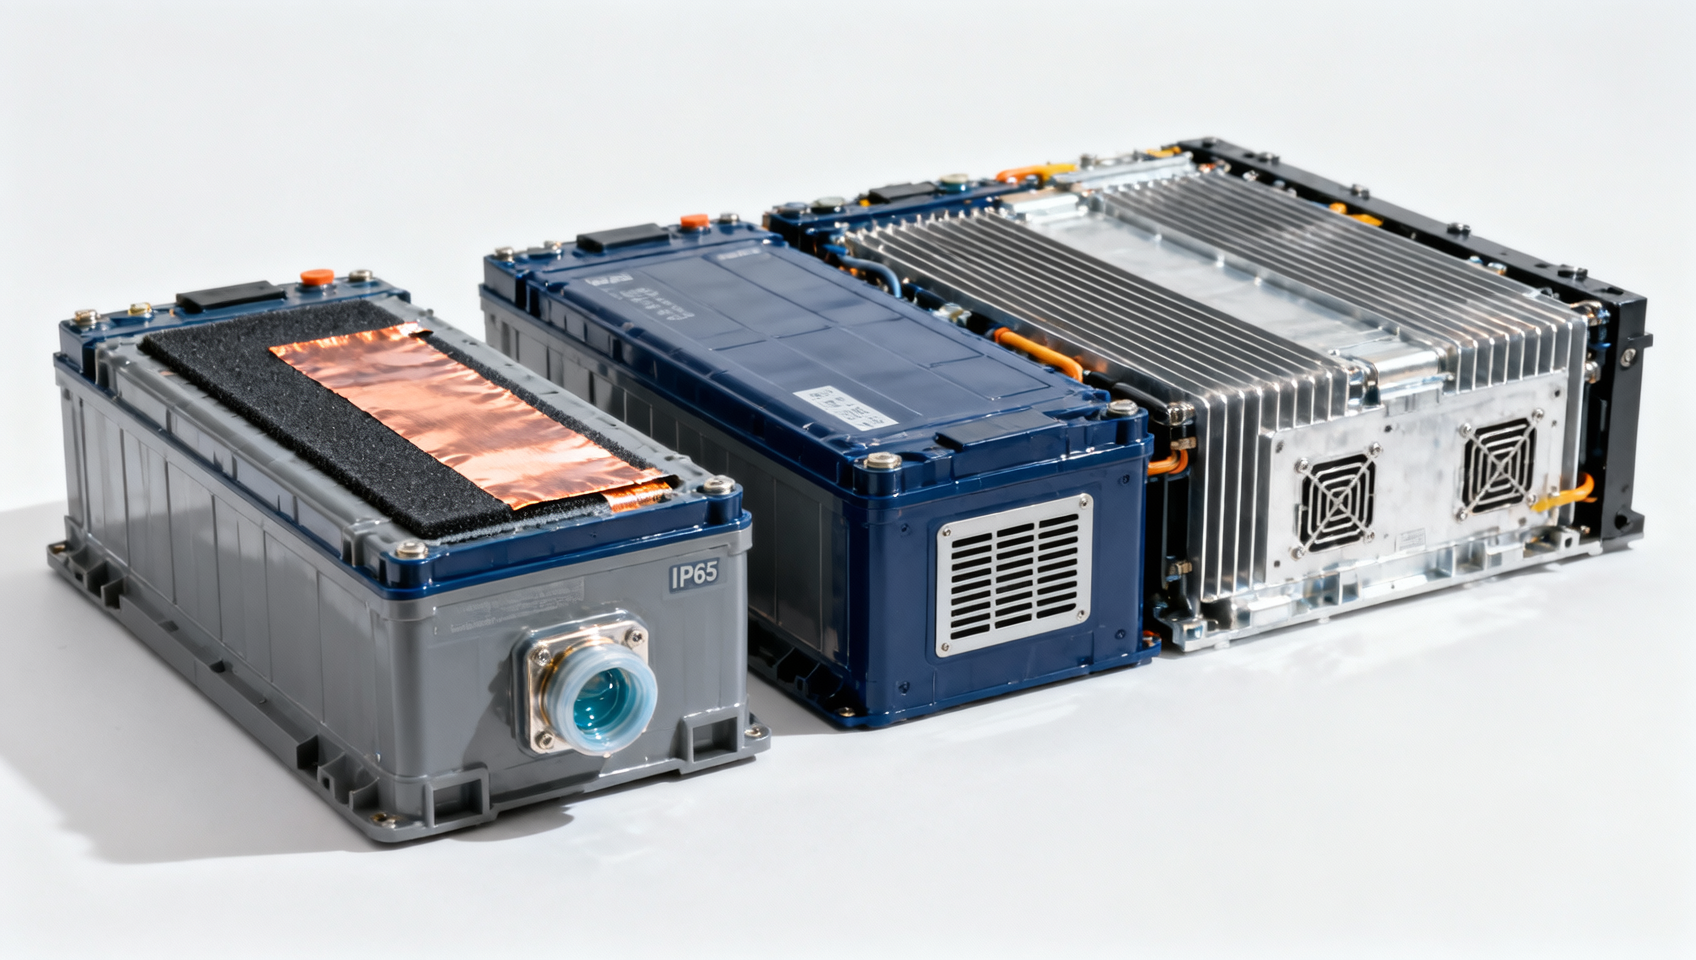
Cells provide electrochemical energy storage. A complete pack also incorporates structural components, electrical connections, battery management electronics, and thermal management, although supplier scope varies.
A quoted cell price therefore cannot substitute directly for an installed pack price. Additional assembly, testing, logistics, and integration costs must be identified first.
Similarly, manufacturing cost should have a defined scope: materials, purchased components, direct labor, factory overhead, and depreciation may be treated differently across manufacturers’ calculations.
Retail price includes additional commercial considerations, potentially covering distribution, marketing, corporate overhead, taxes, and profit. Dividing battery cost by retail price answers a different question.
Request a reconciliation whenever one proposal includes warranty provisions, inbound freight, or factory depreciation and another excludes them. Otherwise, apparent savings may reflect accounting differences.
What do published battery price benchmarks actually tell you?
Published battery surveys provide useful reference points, but their averages are not equivalent to a binding supplier quotation for a specific vehicle production program.
BloombergNEF’s 2024 survey reported an average lithium-ion battery pack price of $115 per kWh across applications, while battery-electric vehicle packs averaged $97 per kWh.
Those figures describe historical survey results, not current procurement offers. Geography, chemistry, order volume, contractual terms, and technical requirements can materially change achievable pricing.
Using the historical $97 benchmark, a 60 kWh pack implies approximately $5,820. That estimate is useful for initial screening, subject to confirming capacity and scope.
It does not establish a manufacturer’s actual cost. Buyers may face different qualification requirements, delivery charges, local sourcing constraints, or specifications than the survey average.
For broader market context, the International Energy Agency tracks battery pricing and supply chains. Use dated benchmarks alongside current quotations when preparing investment decisions.
Which factors move battery cost share most?
Pack capacity and vehicle efficiency
Battery capacity often has the clearest immediate effect. At $100 per kWh, adding 10 kWh increases the simple pack estimate by approximately $1,000 per vehicle.
However, capacity should be evaluated against usable range, payload, charging performance, and climate requirements. Additional capacity has limited business value when customers rarely need it.
More efficient motors, aerodynamics, tires, and thermal systems can enable a smaller battery for similar range. Their incremental cost should be compared with avoided battery spending.
Confirm whether specifications report gross or usable capacity. Mixing a price based on gross capacity with usable capacity can understate the estimated pack cost.
Cell chemistry and pack design
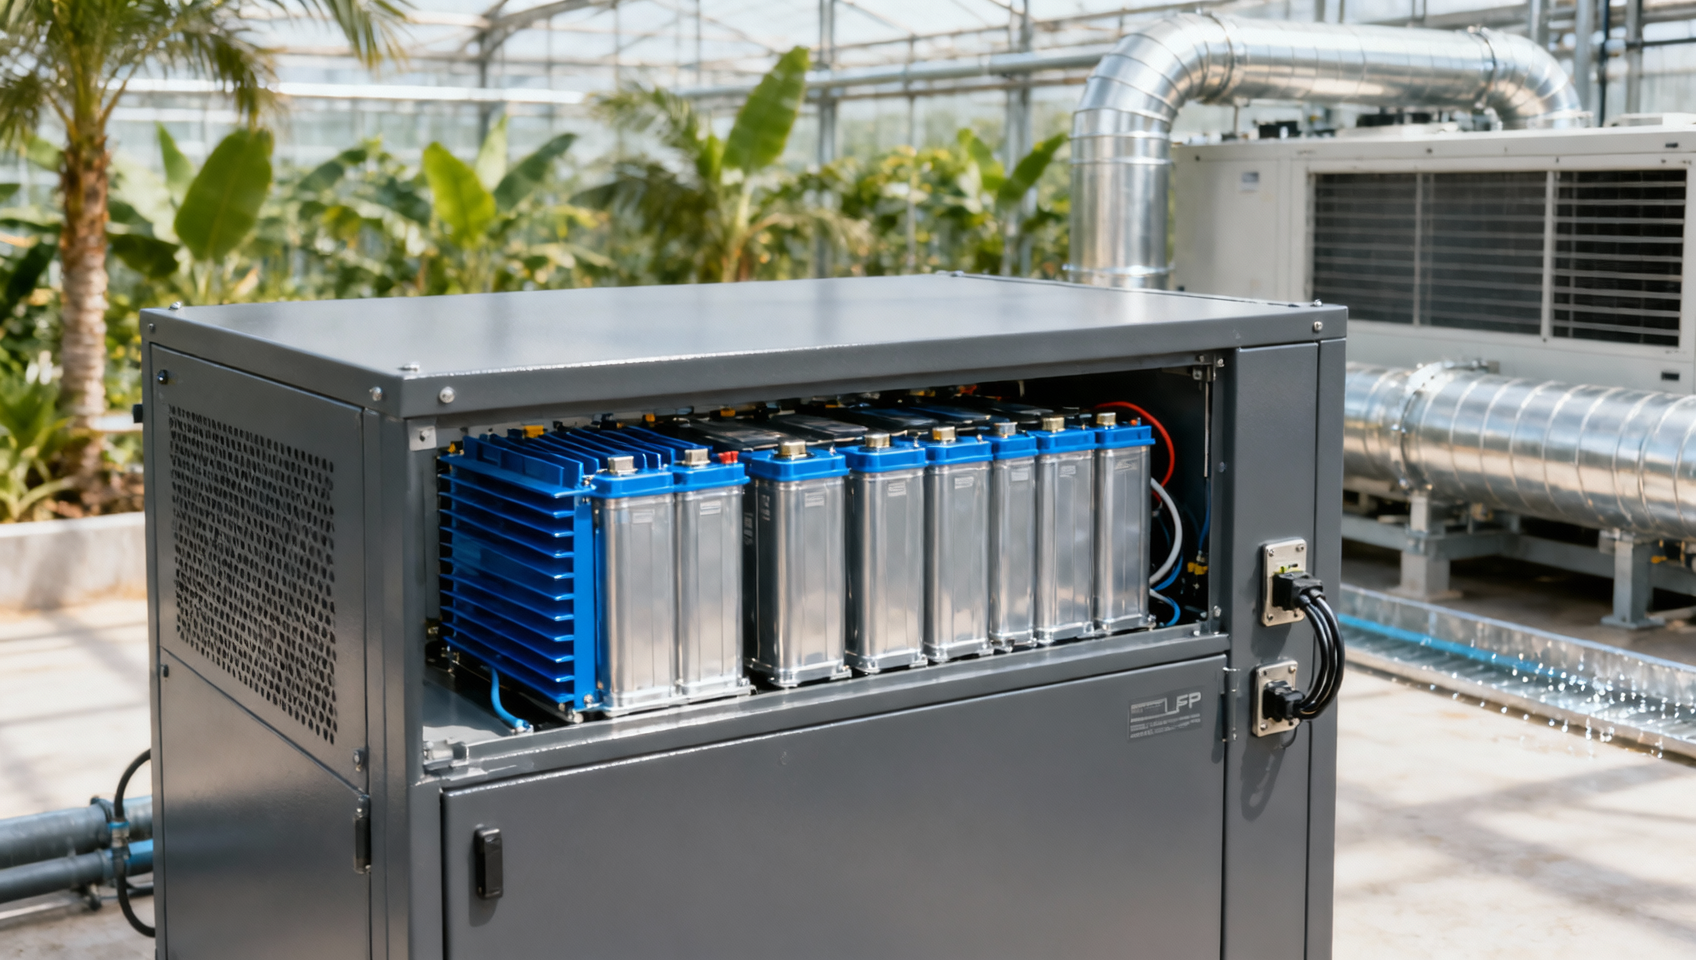
Lithium iron phosphate, commonly called LFP, generally offers lower material costs than nickel-rich chemistries. It can suit vehicles prioritizing affordability, durability, and moderate range.
Nickel-rich chemistries can support higher energy density, which may matter for weight-sensitive or long-range vehicles. Their suitability depends on complete vehicle requirements and supplier execution.
Compare the cost of meeting the specification, including packaging and thermal management. A lower cell price does not automatically produce the lowest vehicle manufacturing cost.
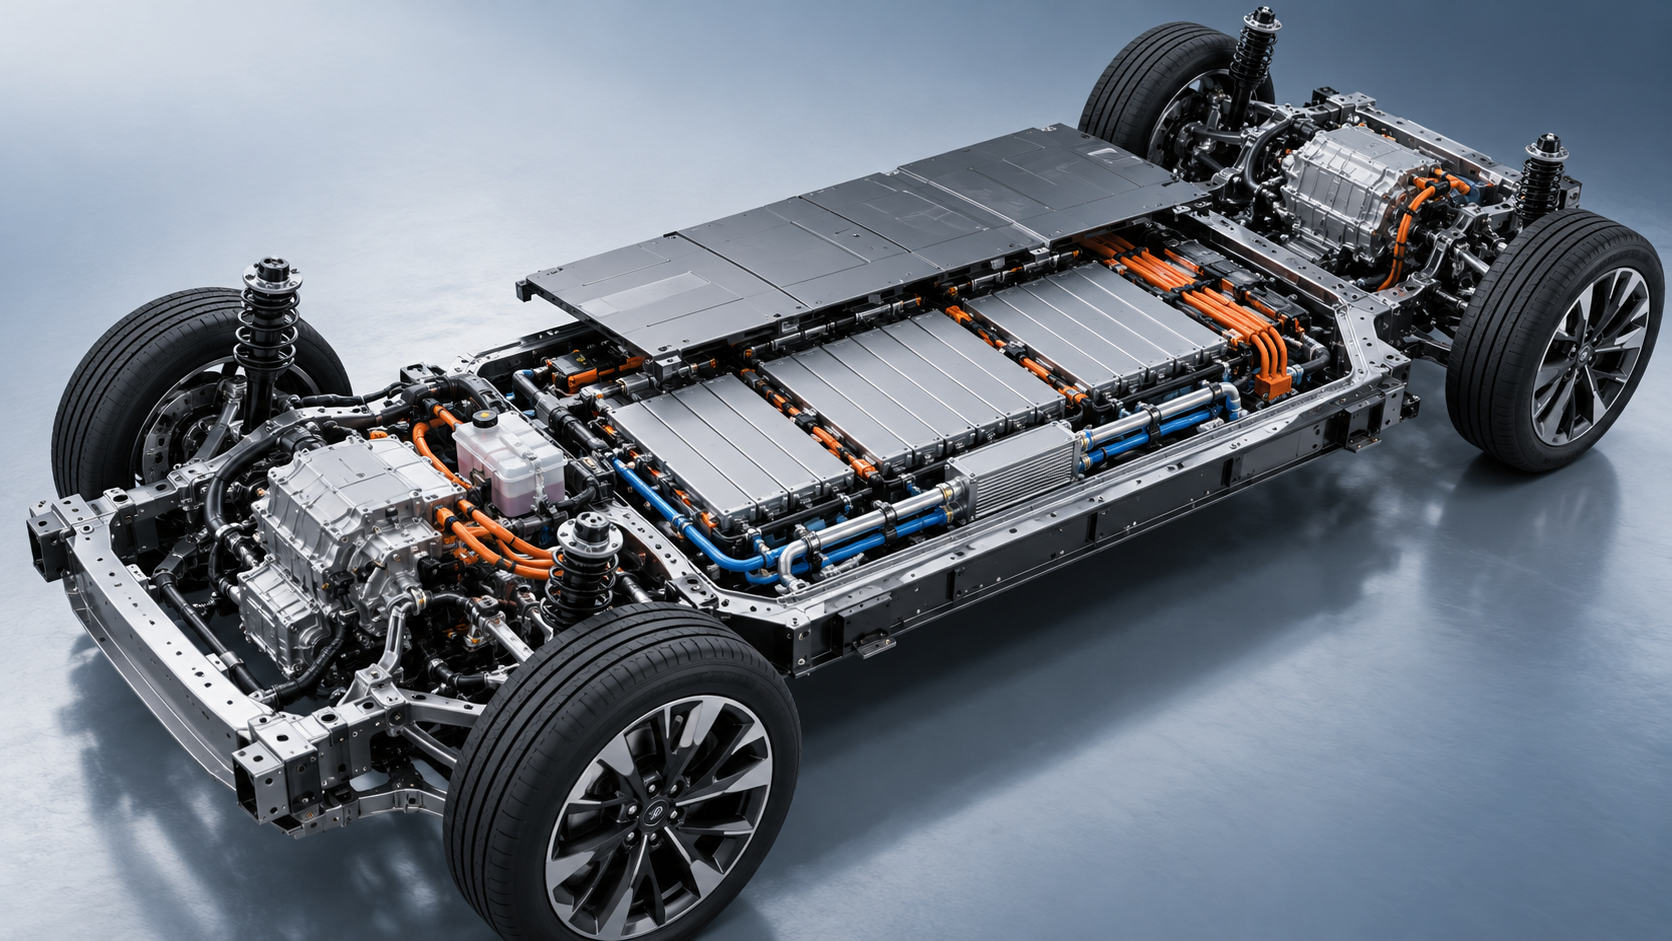
Pack architectures that reduce modules or integrate structural functions may remove components. Evaluate these savings alongside repairability, manufacturing yield, service procedures, and replacement exposure.
Location, purchasing terms, and production scale
Supplier location affects labor, energy, transportation, tariffs, and access to materials. Policy incentives may improve project economics, but eligibility and durability require separate assessment.
Large purchasing commitments can support favorable prices, yet minimum volumes and take-or-pay provisions may create liabilities when vehicle demand falls below the original forecast.
Factory utilization also matters. Low output spreads fixed manufacturing costs across fewer vehicles, potentially overwhelming savings achieved through an attractive battery supply agreement alone.
How do battery savings translate into vehicle margins?
A lower battery price reduces manufacturing cost only to the extent that savings survive contractual adjustments, integration expenses, quality losses, and changes elsewhere in the vehicle.
Consider a 60 kWh pack whose price falls from $120 to $100 per kWh. The direct pack saving equals $1,200 for each vehicle produced.
If the original vehicle manufacturing cost was $25,000, the revised cost becomes $23,800, assuming all other costs remain unchanged and savings are fully captured.
The battery’s share falls from 28.8% to approximately 25.2%. More importantly, the manufacturer gains $1,200 of potential gross profit per vehicle before other effects.
At 100,000 vehicles annually, that represents $120 million in potential annual manufacturing savings. Treat this as a scenario, not a forecast of realized earnings.
Competitive price cuts may transfer savings to customers. Warranty spending, supplier renegotiations, or lower production volumes can also reduce the improvement ultimately visible in reported margins.
Evaluate savings under stable selling prices and under competitive price reductions. This reveals whether cheaper batteries strengthen profitability, affordability, or both under realistic market conditions.
Does making batteries internally improve competitiveness?
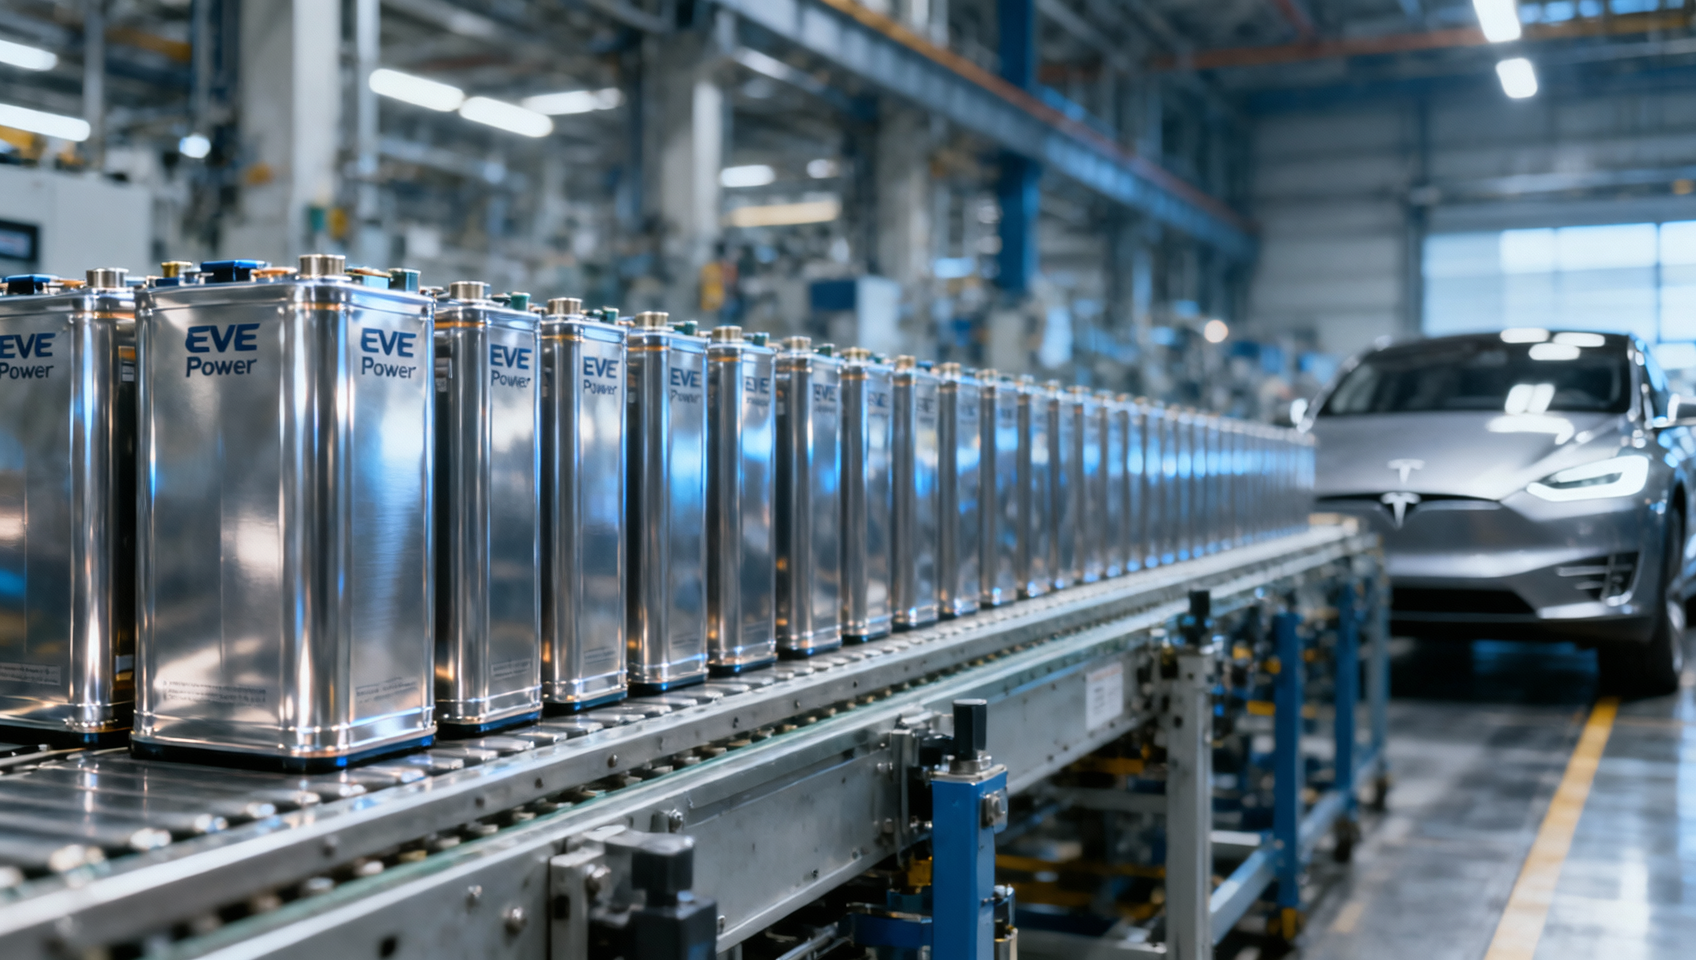
Internal battery production can provide greater control over specifications, supply availability, and process improvements. It also introduces capital expenditure, production ramp challenges, and utilization risk.
A supplier quotation and an internal transfer price are not automatically comparable. Internal estimates may omit capital recovery, startup losses, or centrally allocated engineering expenditure.
Ask whether the analysis includes equipment depreciation, financing assumptions, scrap, maintenance, energy, staffing, and warranty responsibility. Check the output level required to achieve projected costs.
Buying from an established supplier may offer stronger economics at modest volumes. Internal production becomes more attractive when scale, technical capability, and sustained demand align.
Evaluate incentives separately from underlying production efficiency. A subsidy-supported project may be financially attractive while remaining exposed to policy changes or future eligibility restrictions.
What should a business evaluator request before accepting a cost claim?
A credible assessment connects the battery quotation to vehicle specifications, manufacturing assumptions, and contractual obligations. The following evidence helps turn headline percentages into defensible comparisons.
- Matched technical specifications: Gross and usable capacity, chemistry, energy density, charging requirements, thermal performance, cycle life, and agreed testing conditions.
- Complete commercial scope: Pack components, integration responsibilities, freight, duties, tooling, qualification expenses, currency assumptions, payment terms, and delivery location.
- Production assumptions: Annual volumes, factory utilization, yield, scrap treatment, ramp timing, capacity commitments, and allocation of depreciation or overhead.
- Risk allocation: Warranty coverage, degradation limits, replacement obligations, raw-material adjustments, minimum purchases, and remedies for missed deliveries or quality failures.
Separate recurring production costs from one-time engineering and tooling payments. Amortize those payments over a realistic vehicle volume to expose their effective per-unit burden.
Then build sensitivity cases around pack prices, capacity, output, and exchange rates. Include weaker demand, because reduced utilization can change both vehicle and battery economics.
For sourcing decisions, compare total expected program cost rather than the lowest quoted dollar-per-kWh figure. Reliability and enforceable warranty terms can justify a higher price.
How should battery cost share influence the final decision?
Battery share is a useful diagnostic measure, but a lower percentage alone does not prove competitiveness. High nonbattery costs can make that percentage look favorable.
Likewise, a higher battery share may reflect a deliberately larger pack or efficient spending elsewhere. Interpret the ratio alongside absolute manufacturing cost and product positioning.
The strongest evaluation combines three measures: battery cost per vehicle, total manufacturing cost per vehicle, and expected margin at a realistic selling price and volume.
For initial screening, test a 20%–40% battery share through explicit scenarios. Replace those assumptions with verified, consistently defined costs before approving procurement or investment.
Manufacturers build durable advantages by matching battery capacity, chemistry, sourcing, and factory scale to customer needs. That alignment determines whether battery spending creates commercial value.