How to size DC fast EV charging stations for peak charging demand
Key Takeaways
- Adipic Acid CAS 124-04-9 Market Trends: Why Buyers Are Rebuilding Supply PlansLead Materials Scientist
- How technology forecasting can reduce investment risk in cloud infrastructureIT & Security Director
- How to size DC fast EV charging stations for peak charging demandIT & Security Director
- When does modular construction reduce a project's total cost?Chief Civil Engineer
- What cloud infrastructure analysis reveals about Singapore latency risksIT & Security Director
- How to verify recycled green building materials meet project standardsChief Civil Engineer
- What to evaluate when comparing cybersecurity analysis providersIT & Security Director
- When does agricultural automation equipment pay off for mid-size farms?Agri-Tech Strategist
Industry Overview
We do not just publish news; we construct a high-fidelity digital footprint for our partners. By aligning with TNE, enterprises build the essential algorithmic "Trust Signals" required by modern search engines, ensuring they stand out to high-net-worth buyers in an increasingly crowded global digital landscape.
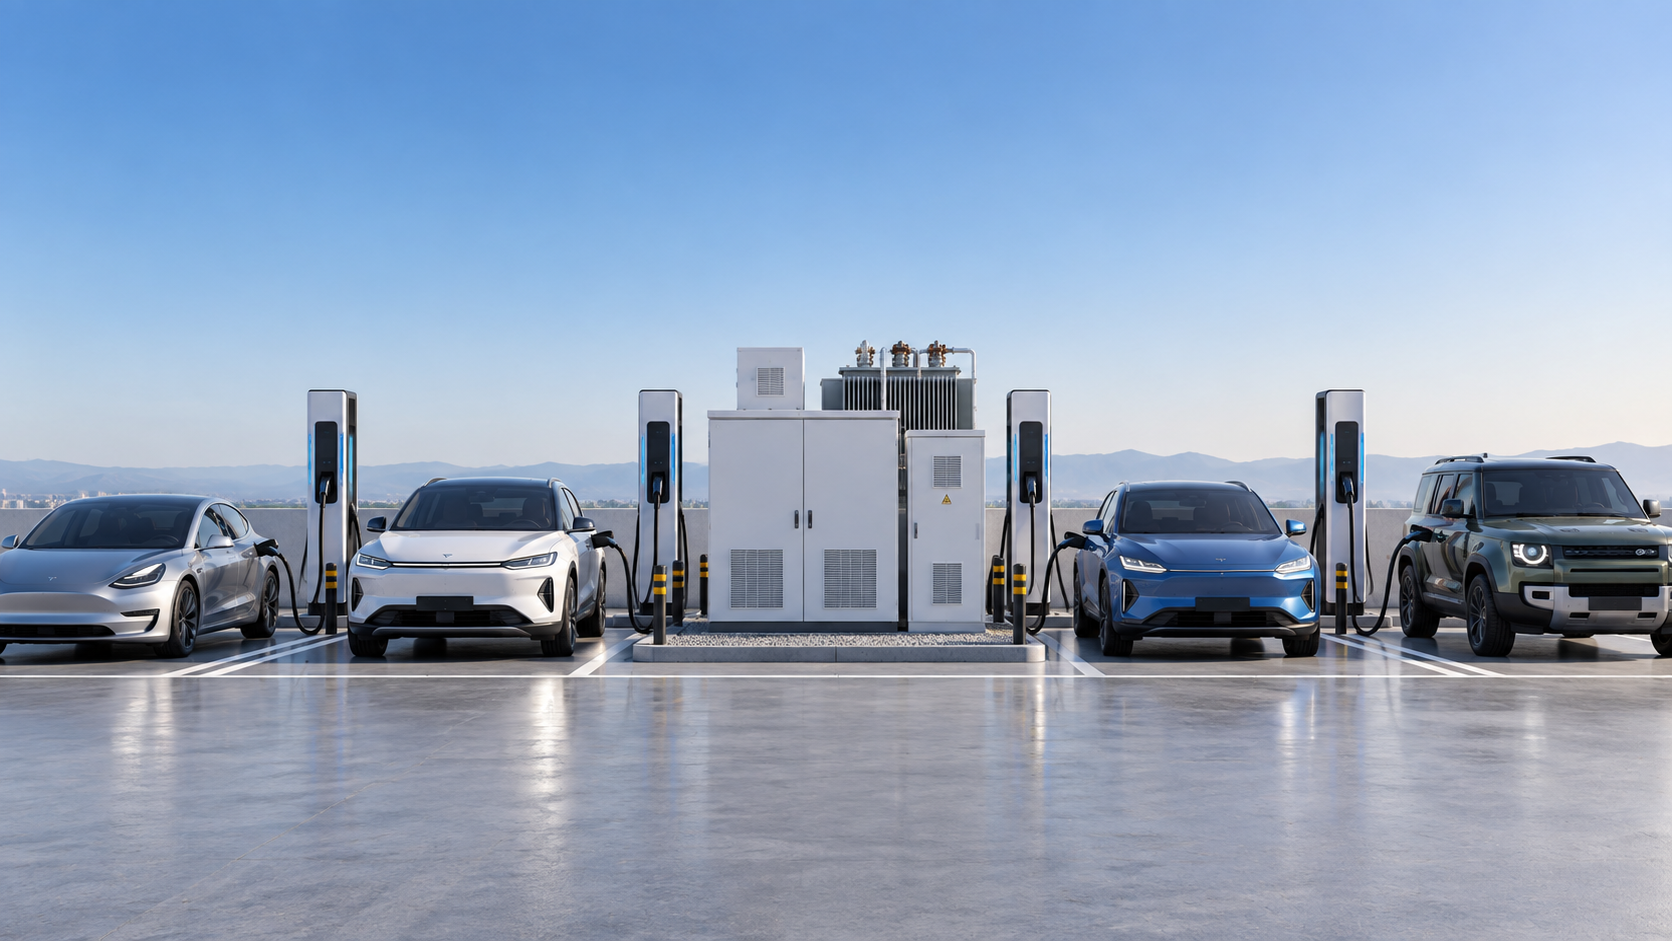
A charging site can look adequately equipped on a layout drawing and still fail during its busiest hour. The usual warning signs are queues forming around a few high-power dispensers, drivers abandoning the site when charging slows, or a utility interconnection that is much larger and more expensive than the actual operating profile requires. For a project manager, the issue is not simply how many plugs to install; it is how much simultaneous charging demand the site must reliably absorb.
The practical answer is to size DC fast EV charging stations from a peak-period demand model, then test that model against charger power, vehicle charging behavior, power-sharing rules, site dwell time, and the utility’s available capacity. Start with the number of vehicles expected during the critical arrival window, estimate the energy each session needs, convert that energy into occupied charging time, and add enough capacity to maintain an acceptable queue. The resulting charger count and electrical service size are related, but they should not be calculated as the same number.
Begin with the peak event, not annual traffic
Daily traffic, annual utilization, and nearby EV ownership are useful planning inputs, but they rarely determine the equipment configuration on their own. A highway-oriented location may experience a pronounced holiday or weekend surge. A fleet depot may have a narrow return-to-base window. A retail destination may see charging demand concentrate around store opening, lunch, or evening activity. The station must be evaluated at the moment when arrivals cluster, because that is when queues, demand charges, and equipment limitations become visible.
Define a peak design window that reflects the operating scenario you are actually trying to protect. This may be an hour, a two-hour arrival block, or a shorter interval where vehicles routinely arrive together. Avoid using a daily average to size the site. Ten sessions spread evenly through a day require a very different installation from ten sessions arriving within forty-five minutes.
For each peak window, collect or estimate the following:
- Expected EV arrivals by vehicle class and use case.
- Percentage of arriving drivers likely to need DC charging rather than destination or overnight AC charging.
- Typical state of charge on arrival and intended state of charge at departure.
- Battery sizes and the usable energy likely to be requested per stop.
- Expected dwell time, including time spent parking, connecting, charging, and leaving.
- Maximum queue time the site can reasonably tolerate.
- Utility constraints, including available capacity, transformer requirements, tariff structure, and interconnection lead time.
At an early stage, these inputs can be scenario assumptions rather than measured facts. The important point is to make them explicit. A station designed around a “typical driver” without documenting the assumed arrival rate, energy need, and charging duration is difficult to validate later.
Convert driver demand into charging workload
The most useful first calculation is energy requested during the peak period. Estimate it as:
Peak charging energy (kWh) = peak arrivals × charging participation rate × average energy delivered per session
Suppose a site expects 24 EV arrivals in its busiest two-hour window. If 70% are expected to charge and the average session requires 32 kWh, the peak charging workload is 538 kWh. That figure does not mean the site needs a 269 kW grid connection merely because the window is two hours long. Arrivals will not be perfectly even, charging power is not constant, and a queue target may require more simultaneous capability than the average energy rate suggests. It does, however, establish a realistic energy requirement that can be compared with proposed equipment.
Energy per session should be based on the usable charging need, not the vehicle’s full battery capacity. A driver arriving at 25% state of charge may only intend to leave at 70% because charging slows near the upper range or because the stop is time-limited. Fleet operations may behave differently: vehicles can arrive at low charge and require a defined amount of energy before the next shift. Separate these patterns rather than blending them into one average.
It is also wise to model a range. A low, expected, and high case will expose whether the design remains workable when session energy or charging participation increases. The high case should be plausible, not an arbitrary worst-case number. Examples include cold-weather energy use, a higher share of long-distance travelers, or a fleet schedule change that compresses charging into a smaller window.
Use charging time, not nameplate power, to determine dispenser count
A charger’s nameplate rating is not the power every vehicle will receive for the full session. Charging power depends on the vehicle’s battery voltage, thermal condition, state of charge, onboard battery-management limits, and the charger’s sharing architecture. A 350 kW dispenser can be appropriate at a corridor site, but it does not automatically reduce every session to a fraction of the time required at a 150 kW unit.
Estimate service time using a realistic average delivered power:
Average session duration (hours) = energy delivered per session (kWh) ÷ average delivered charging power (kW)
If a typical session delivers 32 kWh and the realistic average delivered power across the relevant charging curve is 80 kW, the charging portion lasts about 24 minutes. Add a reasonable allowance for parking, cable handling, payment or authorization, and departure. In a busy site, these non-charging minutes affect throughput because the bay remains occupied.
Next, compare the resulting session duration with the arrival rate. If a peak hour brings 12 charging vehicles and the occupied bay time averages 30 minutes, the station needs roughly six occupied charging positions simply to keep pace with arrivals under an even flow. Real arrivals are not even, so a site intended to avoid persistent waiting needs additional margin. The exact margin depends on how variable the arrivals are, the consequence of a queue, and whether drivers have alternatives nearby.
Separate connectors, dispensers, and power cabinets
These terms are frequently treated as interchangeable during early planning, which can distort both cost and capacity assumptions.
- Charging position or bay: the physical parking space and user-facing connection point.
- Dispenser: the unit a driver interacts with; one dispenser may have one or more connectors.
- Power cabinet: the DC conversion equipment supplying one or several dispensers.
- Installed site power: the maximum DC output the charging system can produce, subject to controls and upstream electrical limits.
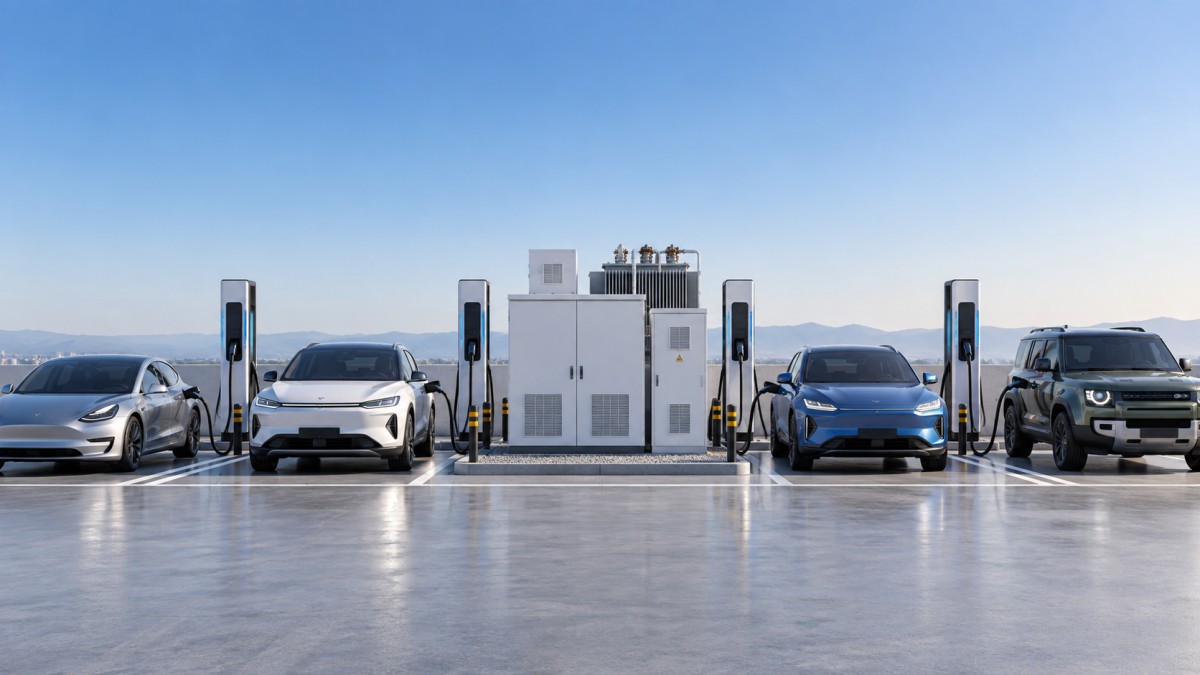
A site may have eight charging bays but only 600 kW of shared power. That can work well where vehicles arrive gradually and most sessions need moderate energy. It can produce long waits or lower-than-expected charging rates where several high-demand vehicles connect at the same time. Count physical bays for queue management, but size the power system for concurrent energy delivery.
Model the coincidence factor instead of assuming every port peaks together
Electrical service sizing requires a different view from bay sizing. It is usually neither realistic nor economical to multiply every connector’s maximum rating by the total connector count. At the same time, using a very low diversity assumption can create a site that performs poorly exactly when demand is highest.
The key question is: how much charging power is likely to be requested simultaneously during the peak design event? This is the coincident demand. Build it from expected session overlap and realistic charging curves. A vehicle may draw high power shortly after connection, then taper as the battery fills. Several vehicles can overlap at different stages, producing a site load lower than the sum of their nameplates but higher than a simple average-energy calculation.
Power sharing can reduce the upstream capacity requirement while retaining adequate bay count. For example, a modular cabinet may allocate more power to a vehicle that can accept it and less to a vehicle nearing its charge target. This approach is effective only when the allocation logic, minimum power per active session, and expected mix of vehicles are understood. A shared-power system should be tested against the peak queue model, not selected solely because its total connected load appears lower.
Choose power levels around dwell time and vehicle mix
The appropriate rating is tied to the energy that must be delivered before the driver is ready to leave. A site where drivers stop briefly needs enough power to deliver meaningful range within that short stay. A destination where vehicles remain parked longer may gain more from additional ports and balanced power than from a small number of ultra-high-power chargers.
Start by asking what energy must be delivered within the available dwell time. If the operational requirement is 40 kWh in approximately 25 minutes, the average delivered power must exceed 96 kW before allowing for losses, tapering, and non-charging time. A 50 kW unit may technically charge the vehicle, but it may not meet the service expectation. Conversely, specifying 350 kW hardware where most vehicles can only sustain a much lower average may add cost and grid burden without increasing peak throughput proportionally.
Vehicle mix matters. Passenger vehicles, light commercial vehicles, buses, and specialized fleet equipment may have different connector standards, battery voltages, charging curves, and parking geometries. Do not assume one connector type, cable reach, or bay layout will serve every expected vehicle. Physical access problems can reduce usable capacity even when the electrical model is correct.
Translate the charging design into utility and site infrastructure requirements
Once the peak coincident load is modeled, add the site’s non-charging loads and account for electrical losses. The utility connection must support the charging system, lighting, communications, payment equipment, HVAC where applicable, and any existing building demand that shares the service. The final requirement should be expressed in the electrical terms required by the utility and local design process, rather than as a loose sum of charger labels.
Early coordination should clarify the point of interconnection, available voltage, transformer scope, metering arrangement, protection requirements, civil routing, and any limits on ramp rate or maximum demand. A site with adequate space for chargers may still face substantial schedule impact if distribution upgrades or new medium-voltage infrastructure are needed. These constraints can change the preferred architecture from fully installed capacity to phased installation, managed power, or a combination of DC charging and lower-power alternatives.
Demand management can be valuable when it has a defined operating rule. A controller might cap site load below a utility threshold, stagger fleet charging, or reduce output temporarily when a building load peaks. The design question is not whether a controller exists; it is whether the reduced charging power still meets the queue and departure-charge requirements. Model the cap during the same peak event used to select charger quantity.
Plan expansion without oversizing the first build
A scalable site does not require every future charger to be energized on day one. It does require that difficult-to-replace elements are considered before pavement, landscaping, and switchgear are finalized. Conduit routes, communications pathways, spare panel capacity, transformer space, bay geometry, accessible parking requirements, and utility easements can all affect later expansion cost.
Phase the project around validated triggers rather than a vague expectation of growth. Useful triggers may include repeat queue formation during defined peak windows, sustained utilization of existing bays, fleet additions with known charging schedules, or confirmed utility capacity availability. This prevents an initial build from carrying unnecessary equipment cost while avoiding a design that can only expand through disruptive reconstruction.
Validate the model with an operational stress test
Before approving the layout and electrical scope, run at least one stress scenario: arrivals bunch near the start of the peak window; several vehicles request larger-than-average energy; one charger or power module is unavailable; and the site operates under its proposed demand cap. Review the resulting queue length, waiting time, delivered energy, and site load over time.
The stress test often reveals the real weak point. It may be too few bays, insufficient shared cabinet capacity, a demand cap that forces sessions beyond the intended dwell time, or a circulation layout that prevents the next vehicle from entering an open space. Correcting those issues in the planning model is far less disruptive than correcting them after construction.
A defensible sizing decision for DC fast EV charging stations therefore documents more than a port count. It shows the peak arrival assumption, session-energy range, occupied-bay time, power-sharing behavior, coincident electrical demand, utility boundary, and expansion path. That record gives engineering, procurement, operations, and the utility a common basis for deciding whether the proposed station will perform when demand is concentrated rather than merely when demand is averaged.
Deep Dive
Related Intelligence
 Energy ManagementMaximizing ROI: Why Enterprises are Investing in Commercial and Industrial Energy StorageAnalyst:IT & Security Director
 Energy ManagementEdge Computing Hardware in Automated Poultry Barns Needs Redundancy — But Most Installations Skip ItAnalyst:IT & Security Director
 Energy ManagementAcrel Targets 5% Overseas Revenue by 2025, Focuses on Southeast Asia Microgrid SolutionsAnalyst:IT & Security Director